담당자님,
추가 질문 있습니다.
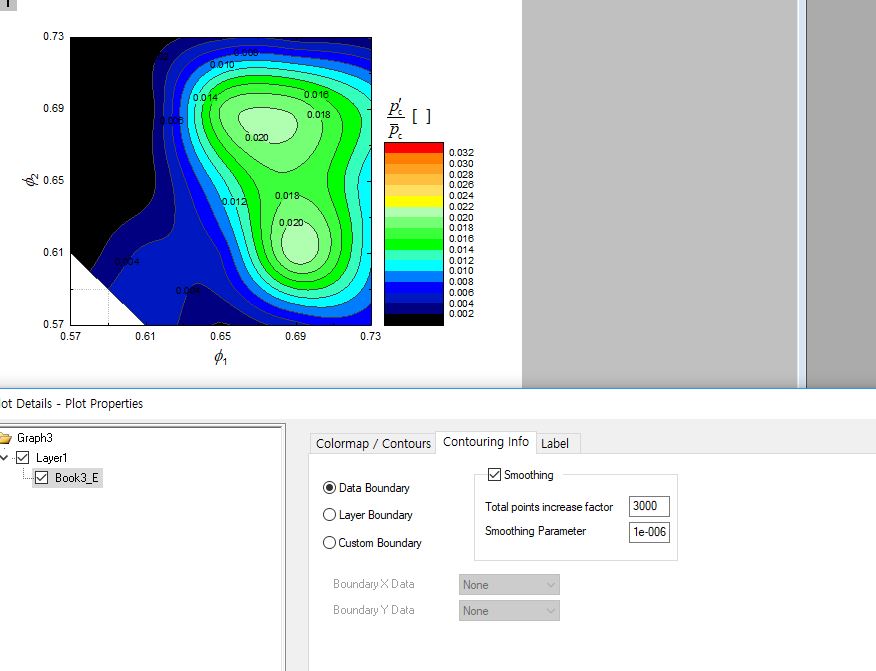
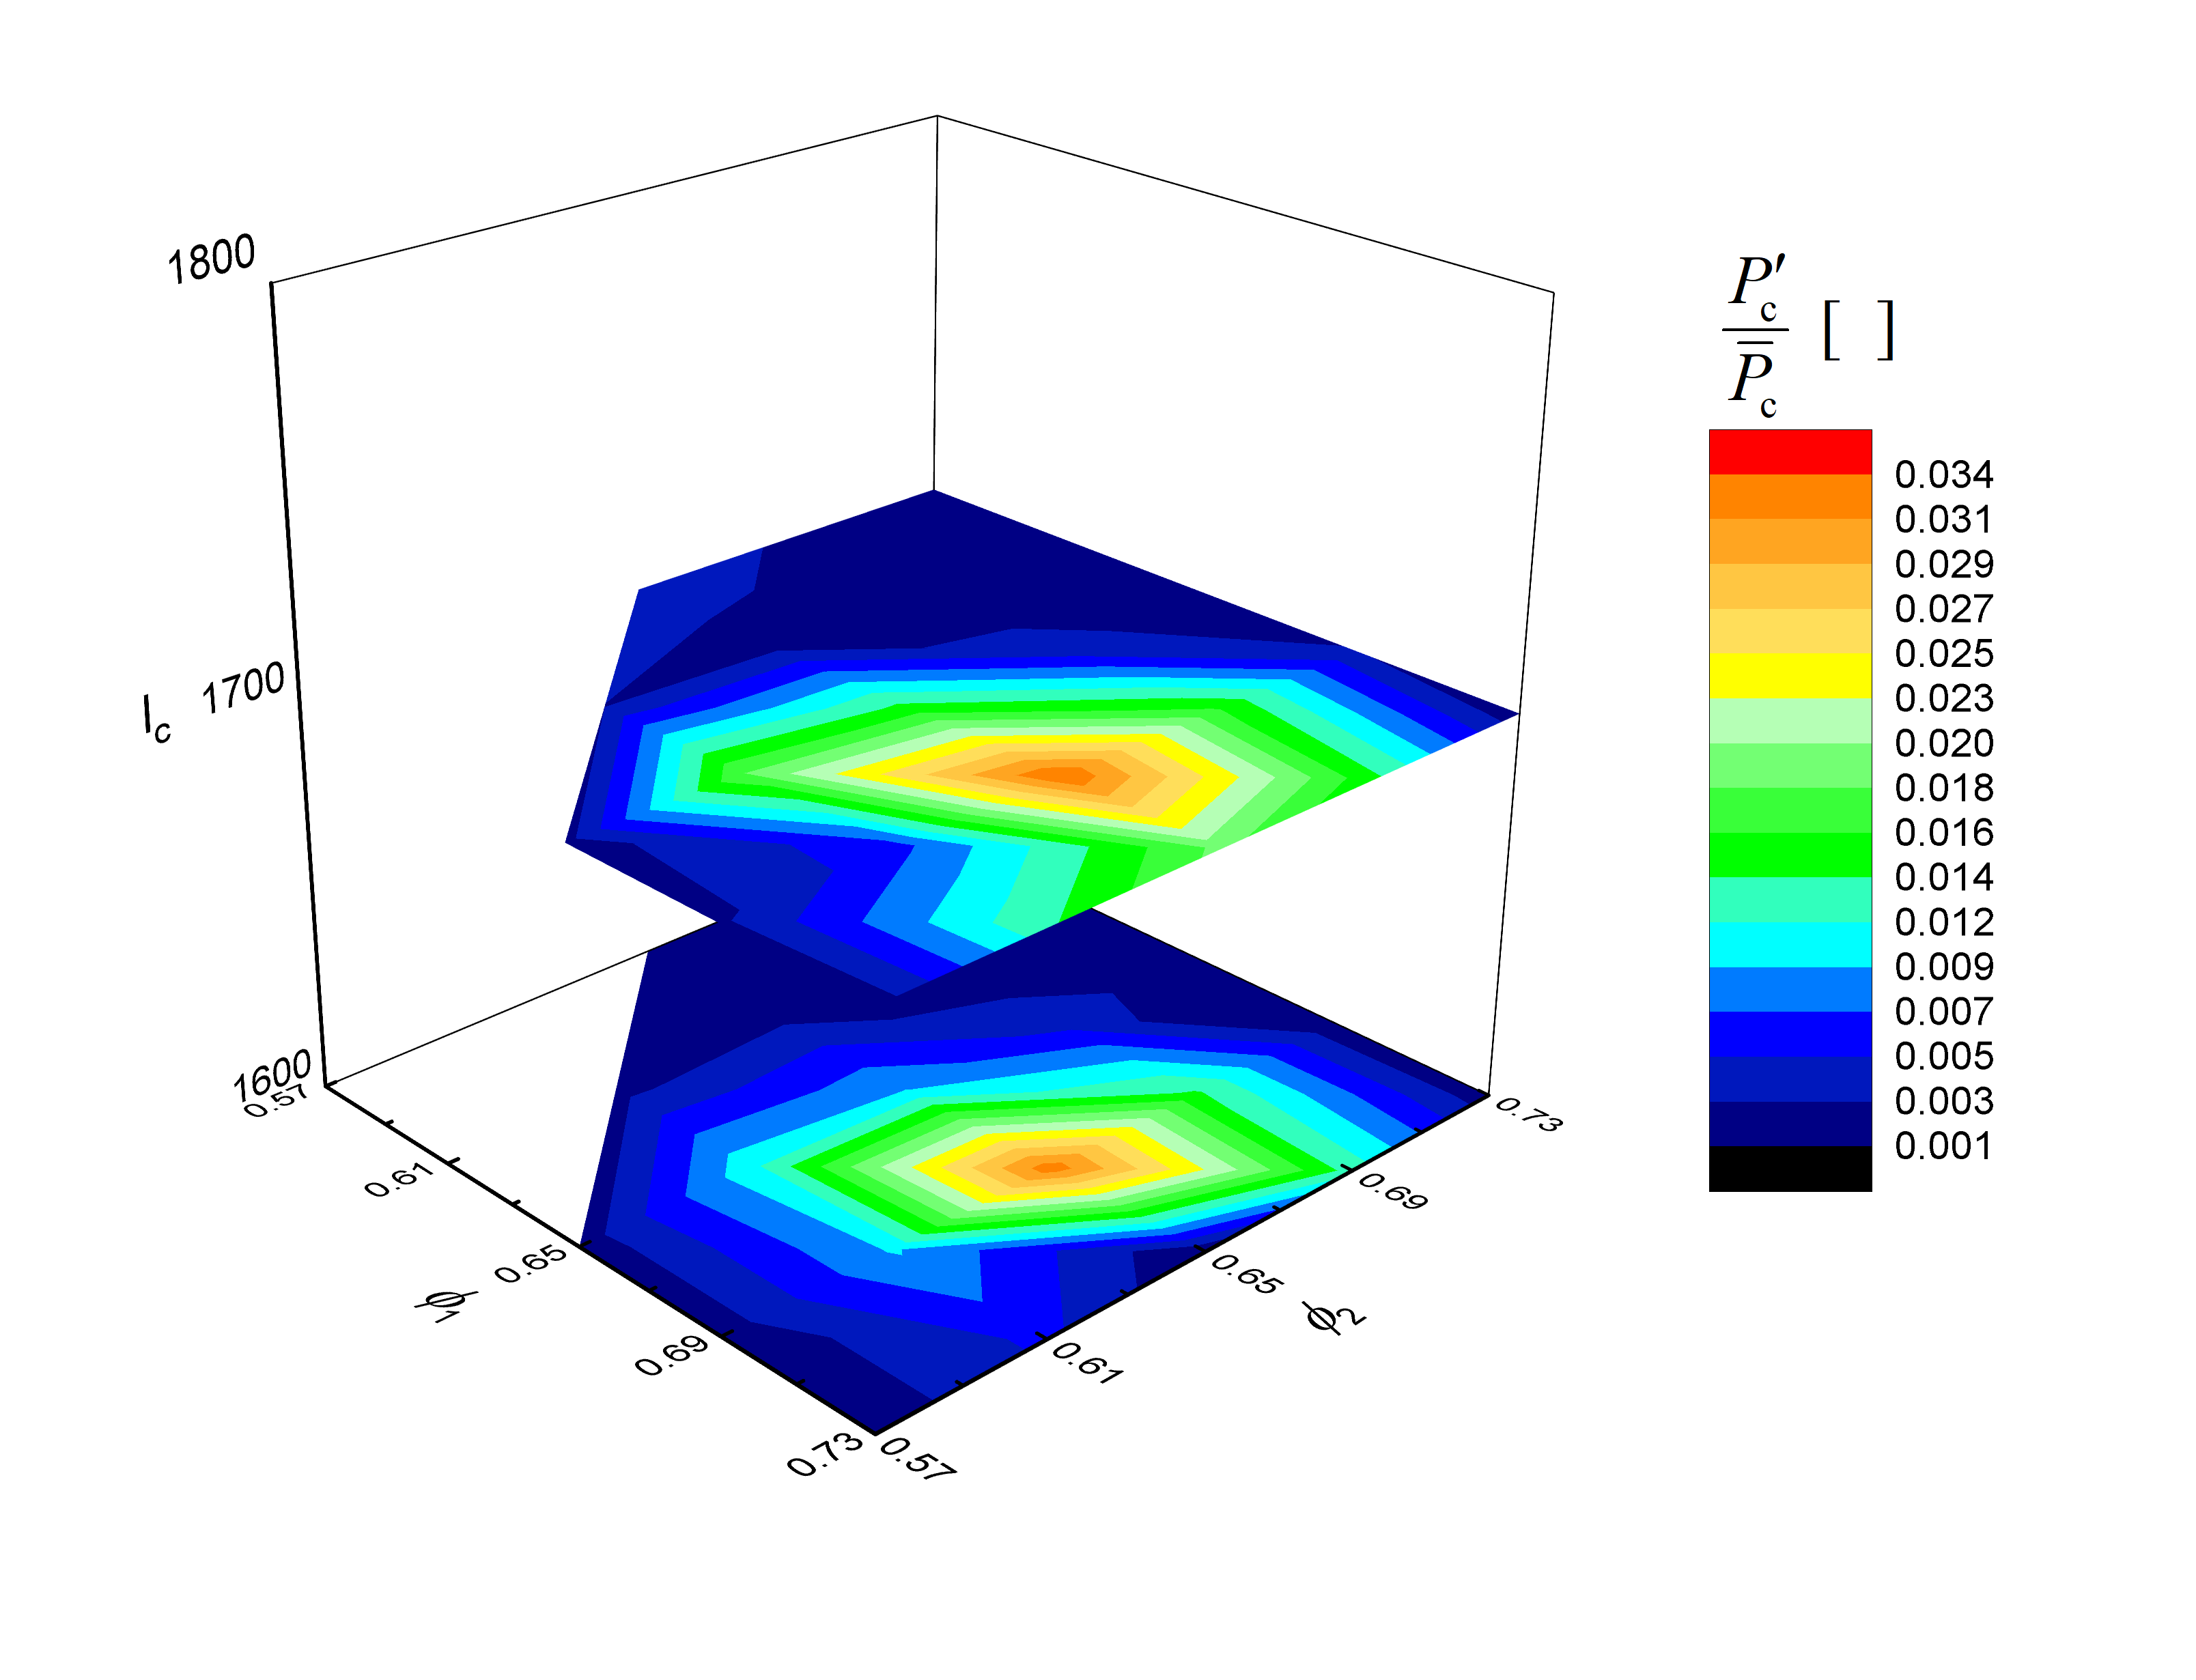
1. 3d로 아래 첨부드린 2d contour를 쌓아서 plot 하고 싶은데 이럴 경우엔 어떤 기능을 사용하는 것이 좋은가요?
2. smoothing parameter를 변화시킴에 따라 contour 품질이 바뀌는 원리에 대해서 답변 부탁드리겠습니다.
김대건 드림.
------- 원본 내용 ---------
안녕하세요.
말씀 하시는 기능이 'Smoothing'을 원하시는 것 같습니다만,
아쉽게도 3D contour 그래프의 경우 이 부분이 지원 되지 않습니다.
Contour Graph features by Data Format
The following table shows the data formats required to make Contour Graphs and features available in each. You can get more information about creating Contour graphs in Creating Contour Graphs.
| Data Format | Polar Contour | Ternary Contour | Smoothing | Custom Boundary | Nonlinear X/Y Axes for Rectangular Contour Plots |
|---|
| XYZ Columns in Worksheet | Yes | Yes | Yes | Yes | Yes |
| Matrix Window | Yes | No | No | No | No |
| Virtual Matrix in Worksheet | No | No | No | No | Yes |
3D Graph features by Data Format
The following table shows the data formats required to make 3D Graphs and features available in each. You can get more information about creating 3D graphs in Creating 3D Graphs
| Data Organization | Smoothing | Nonlinear X/Y Axes |
|---|
| XYZ Columns in Worksheet | No | Yes |
| XYY Columns in Worksheet | No | Yes |
| Matrix Window | No | No |
| Virtual Matrix in Worksheet | No | Yes |
출처 : https://www.originlab.com/doc/Origin-Help/3D-Contour-Graphing
그리고 추가적으로 contour 에서 사용 되는 interpolation 은 Linear interpolation 으로
contour 그래프가 그려지는 알고리즘은 아래 페이지에서 자세한 설명을 확인 하실 수 있습니다.
출처 :
감사합니다.
------- 원본 내용 ---------
안녕하세요. 담당자님.
제가 말씀 드린 resolution 부분은 제가 보내드린 3차원 그래프의 contour를 보면 각이 져있음을 알 수 있습니다. 2D contour의 경우, 아래 첨부드린화면 상에서 smoothing이라는 부분을 조작하여 contour의 각진 부분을 매끄러운 곡선으로 바꾸었습니다. 하지만 3D colormap의 경우 제가 이 기능을 찾질 못해서 도움을 요청하고자 글을 남긴 것입니다.
시리얼 넘버는 GF3S5-6089-7612506 입니다.
추가적으로 질문드립니다. 아래 그림은 2D contour 인데요. 제가 data를 넣으면 origin이 자동으로 저 contour를 그리는데, contour 기능에서 사용되는 interpolation 기법이 무엇인가요?
감사합니다.

------- 원본 내용 ---------
안녕하세요. 김대건님.
문의 주신 내용은 잘 받았습니다.
다만 문의 하신 내용 중에서 ‘resolution’ 부분과 이걸
조절 한다는 내용이 이해가 가지 않아
이를 추가적으로 설명 해 주셨으면 합니다.
그리고 사용 중인 오리진 제품의 시리얼 번호를 알려 주셨으면 합니다.
이는 제조사 측으로 문의 시, 필요한 정보 입니다.
감사합니다.
------- 원본 내용 ---------
안녕하세요. 저는 일전에 오리진 프로를 구매했었던 카이스트 김대건이라고 합니다.
오리진을 사용함에 있어 궁금한점이 있어 연락드리게 되었습니다.
아래 첨부한 그래프는 오리진의 3d colormap surface를 이용하여 그린 그래프입니다. matrix를 만들어 3d colormap surface를 이용하여 surface를 만든 뒤, plot details의 surface display에서 flat을 눌러 아래 그래프와 같이 만들었습니다.
하지만 아래 그래프에서 contour의 resolution이 좋지 않음을 발견하였고 이를 해결하기 위해 검색을 하며 방법을 찾아보았지만 찾을 수 없었습니다.

제가 일전에 2d contour color fill 기능을 이용하여 아래와 같은 그래프를 그렸을 때에는 resolution을 조정하는 smoothing 이 존재하였습니다. 하지만 3d surface의 경우 제가 찾지를 못했습니다. 기술적 답변 부탁드립니다.